After payroll runs, costing data travels from Oracle HCM into your finance system. Most teams assume it arrived correctly. Here is how to know for certain.
The moment everything feels fine — until it isn’t
Payroll ran. Costing completed. The integration file landed in the finance system and journals were posted. Three weeks later, an auditor finds a $47,000 discrepancy in salary costs against a cost centre that doesn’t match what Oracle HCM shows. Four days of investigation later, the answer: a mapping rule changed mid-month and wasn’t reflected in that payroll run’s integration file. The data left HCM correctly. It arrived in finance incorrectly. Nobody caught it because nobody compared the two files before close.
| Who | What they said |
|---|---|
| Finance | We posted what the integration file contained. That came from HR. |
| Payroll | The Costing Results report shows the correct amounts. The issue is in the integration. |
| IT | We’d need to pull the logs and compare file versions. Give us a few days. |
| Everyone | So we don’t actually know what was posted versus what should have been posted. |
This gap exists in almost every Oracle HCM implementation where costing data flows into a separate finance system. The integration works most of the time. But at 40,000 rows across two different schemas, comparing the source against the output manually isn’t realistic — which means most teams don’t do it at all.
This post shows a practical architecture that closes that gap: Oracle Integration Cloud handles the row-level reconciliation at scale, and AI explains what it finds in plain language your payroll and finance teams can act on immediately — before the books close, not after.
How payroll costing actually flows from Oracle HCM to your finance system
Before you can understand where things go wrong, you need to understand the path the data travels. In Oracle HCM Cloud, once a payroll run completes, costing is a separate process that follows a specific sequence before anything reaches your finance system.
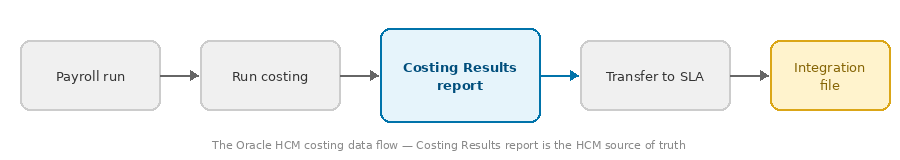
The Oracle HCM costing data flow — the Costing Results report is the authoritative source of truth.
The Oracle HCM Payroll Costing Results report sits at the centre of this chain. It captures every costed element for every employee in a payroll run — broken down by GL cost allocation keys, element name, costed value, debit or credit indicator, and assignment details. It is the authoritative record of what payroll costing produced.
What gets sent to your finance system is a transformed version of that data. The integration layer takes the HCM costing output and converts it into the format your finance system expects: GL journal lines with segment combinations, cost centre codes, account numbers, and whatever other fields your chart of accounts requires. The transformation is necessary. It is also where errors are born.
Every transformation rule is a potential discrepancy. A cost centre added in HCM but not yet mapped in the integration. A new payroll element introduced mid-quarter with no corresponding GL account. A rounding rule that applies differently on the HCM side versus the finance side. None of these are dramatic failures — they are quiet mismatches that compound silently until someone looks closely enough to notice.
The Payroll Costing Results report and the finance integration file contain the same underlying data — but expressed in two completely different schemas, with different column names, different key structures, and different levels of aggregation. That is the comparison challenge at the heart of this use case. And at 40,000 rows each, it is not a challenge you can solve with a VLOOKUP and a spare afternoon.
Why comparing these two files manually is nearly impossible
Put three numbers together and you have a comparison problem that Excel was not designed to solve: approximately 40,000 rows per file, 20+ columns per file expressed in different schemas, and no shared key column between the two systems.
VLOOKUP requires a shared key column — but the HCM Costing Results report identifies records by payroll relationship, element name, and cost allocation key segments, while the finance integration file uses GL journal line identifiers, account combinations, and batch references. There is no single column you can match on directly. Before you can compare a single number, you have to build mapping logic that joins two completely different data models.
Even if you invest the time to build that mapping manually, sheer volume makes human review unreliable. Attention degrades sharply when reviewing large data sets for anomalies — people begin pattern-matching rather than genuinely reading, and quiet mismatches slip through. A $200 rounding error on row 31,847 will not catch anyone’s eye during a manual scroll.
| HCM Payroll Costing Results report | Finance integration file |
|---|---|
| Payroll relationship ID | GL journal batch and line reference |
| Element name and classification | Account code combination (COA segments) |
| Cost allocation key segments (up to 30) | Debit and credit amounts |
| Costed value, debit or credit indicator | Cost centre and natural account |
| Assignment and legal entity details | Period and ledger identifiers |
The comparison problem has two distinct parts: computation — matching 80,000 rows across two schemas and calculating every variance — and comprehension — understanding why each discrepancy exists and what needs to be done about it. Most teams try to solve both with spreadsheets. Neither works well at this scale. The insight that unlocks the solution is recognising that these are two different problems that require two different tools.
Computation is a job for integration technology — fast, deterministic, and tireless at scale. Comprehension is a job for AI — capable of reading a set of exceptions and explaining in plain language what likely went wrong and why. Split the problem correctly and both parts become tractable. Keep them fused in a spreadsheet and neither works.
The architecture: give AI a needle, not a haystack
The solution is a two-layer architecture. Oracle Integration Cloud handles the computation — ingesting both files, mapping their schemas, matching rows, and calculating every variance. What it produces is not another 40,000-row report. It produces a lean exceptions file containing only the rows where the two systems disagree. That file — typically 50 to 300 rows — is what goes to AI. The AI’s job is not to find discrepancies. OIC already did that. The AI’s job is to explain them.
Give AI a needle, not a haystack. OIC finds the needles. AI tells you what they mean.
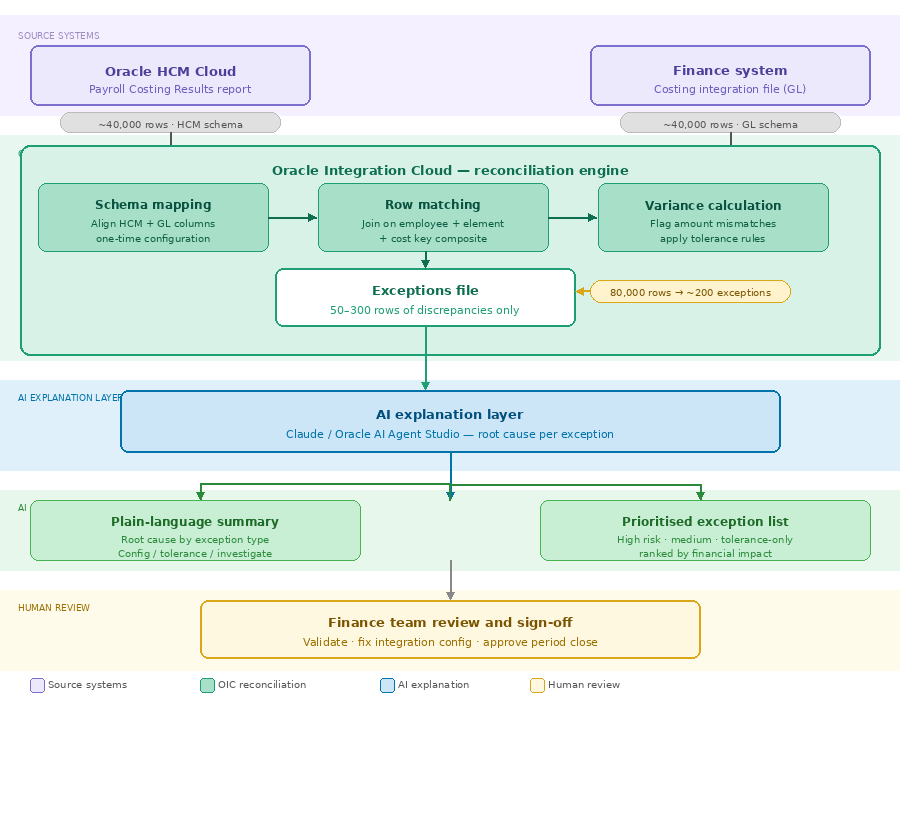
The two-layer architecture — OIC handles 80,000 rows of computation, AI handles ~200 rows of explanation.
What OIC does inside the reconciliation engine
The three steps inside OIC are sequential and deterministic. First, schema mapping: OIC translates the HCM costing columns into a common intermediate format that can be compared against the finance file’s GL structure. This is where you define which HCM cost allocation key segment corresponds to which GL chart of accounts segment — a one-time configuration that captures your organisation’s mapping logic explicitly rather than leaving it implicit in someone’s head.
Second, row matching: OIC joins the two datasets on the composite key you define — typically a combination of employee identifier, payroll element, cost centre, and natural account. Every row in the HCM file is matched against its counterpart in the finance file. Rows that exist in one file but not the other are flagged as missing. Rows that match on key but differ on amount are flagged as variances.
Third, variance calculation: for every matched pair where amounts differ, OIC calculates the absolute and percentage difference and applies your tolerance rules — differences under $1.00 classified as rounding, differences over $500 or 1% escalated as high priority. The output is a clean, structured exceptions file with every discrepancy categorised before it ever reaches AI.
What AI does with the exceptions file
Once the exceptions file lands, AI reads it holistically — not row by row, but as a pattern. It looks for clusters: are 18 of the 23 exceptions all in the same cost centre? Do they all involve the same payroll element? Pattern recognition across a 200-row exceptions file is exactly where AI outperforms both spreadsheets and human reviewers.
Sample prompt for the AI step:
“Here is an exceptions file from an OIC reconciliation of our Oracle HCM Payroll Costing Results report against our finance integration file for the March payroll run. Each row represents a discrepancy between the two systems. For each exception, identify the most likely root cause. Group exceptions by cause where patterns exist. Flag any that require urgent investigation before period close.”
The result is not a list of numbers. It is a narrative: which exceptions are explained by a known integration configuration change, which are within rounding tolerance, and which are genuine anomalies that warrant investigation before the books close.
March payroll close: from 38,400 rows to one genuine issue in 40 minutes
A global manufacturing company runs monthly payroll for 1,920 employees across four legal entities in Oracle HCM Cloud. After each payroll run, a costing integration file is generated and sent to their SAP finance system, where it is posted as GL journals. Historically, the finance team would spot-check ten or fifteen rows against the Payroll Costing Results report and sign off. A rigorous comparison of all rows had never been attempted — it was understood to be impractical.
For the March close, they piloted the OIC reconciliation architecture for the first time. Here is what happened.
|
38,400 Rows compared across both files |
40 min Total time to review and sign off |
What AI found in the exceptions file
OIC produced an exceptions file of 23 rows. The AI read the file and returned the following structured summary:
🟡 18 rows — Configuration: Cost centre mapping rule change effective March 1st
18 rows across Legal Entity 3 show cost centre codes differing between the HCM report and the SAP file. Pattern consistent with the CC-1042 → CC-1098 remapping applied in OIC on March 1st, which was not retroactively applied to the March payroll run. Recommend updating the integration config and reprocessing affected journals before close.
⚪ 4 rows — Tolerance: Rounding differences within defined threshold
4 rows show differences of $0.01 to $0.03. Consistent with currency rounding applied at different points in the HCM-to-SAP transformation. All fall within the $1.00 tolerance threshold. No action required.
🔴 1 row — Investigate: Missing element — Employer NI Contribution not present in SAP file
1 row for employee P-00847 shows Employer National Insurance Contribution of £1,243.60 in the HCM Costing Results report with no corresponding entry in the SAP file. This element may have been excluded from the integration extract definition. Requires investigation before period close — potential GL understatement.
How the morning unfolded
| 9:14 am | OIC reconciliation completes. Exceptions file of 23 rows generated automatically. |
| 9:16 am | AI summary received. Finance lead reviews three-group breakdown: config issue, rounding, one genuine anomaly. |
| 9:31 am | Payroll team confirms the CC-1042 mapping change. Integration config corrected. 18 journals queued for reprocessing. |
| 9:44 am | IT investigates employee P-00847. Employer NI element confirmed missing from extract definition — added and file regenerated. |
| 9:54 am | Finance controller signs off. March payroll costing verified and closed. |
Without this architecture, the same close would have involved a manual spot-check of fifteen rows, a signed-off period, and a £1,243 GL understatement sitting quietly in the books until the next audit. The Employer NI issue would not have been found in March. It would have been found in October.
What this architecture does not solve
It would be easy to present this as a turnkey solution. It is not. There are real constraints worth understanding before you invest in the architecture.
OIC schema mapping is a one-time investment, not a click. Defining how your HCM cost allocation key segments correspond to your finance system’s chart of accounts requires someone who understands both systems. For organisations with complex multi-entity or multi-ledger configurations, this mapping exercise can take several days to design and test correctly. The good news: you do it once, and it runs automatically every payroll period after that.
AI explains exceptions — it does not fix them. The AI output tells you what likely went wrong and why. A human still has to validate that explanation, access the integration configuration, correct the mapping rule or element entry, and reprocess the affected journals. AI narrows the field dramatically. It does not close it.
The quality of the exceptions file depends on the quality of the mapping rules. If your OIC schema mapping is incomplete or incorrect, OIC will produce false positives. Investing time in accurate, well-documented mapping rules pays back every period.
AI root cause suggestions are probabilistic, not certified. When AI says “this exception is consistent with a cost centre mapping change,” it is making an inference from the pattern of the data — not reading your integration logs. Always validate the AI’s explanation against your actual system configuration before acting on it.
This is not a magic button. It is a force multiplier for people who already know what they are doing. The architecture makes expert knowledge faster and more thorough — it does not replace it.
Where to start
You do not need the full OIC architecture running before you can get value from this approach. Here is a practical progression depending on where your team is today.
Step 1 — Run the Payroll Costing Results report for your last completed payroll period. Export it to CSV or Excel. Pull the corresponding costing integration file that was sent to your finance system. Put them side by side and look at the totals by cost centre. If they do not match, you already have your first case for this architecture.
Step 2 — Try a quick manual aggregation before building OIC. Summarise both files at the GL account and cost centre level — collapsing 40,000 rows down to perhaps 300 unique account combinations. Even without OIC, feeding that aggregated comparison to an AI tool will reveal whether systematic patterns exist. This is a same-day proof of concept that costs nothing to run.
Step 3 — Design the OIC schema mapping for your environment. Document which HCM cost allocation key segments map to which finance system fields. This document becomes the foundation for your OIC integration configuration and makes your integration logic visible and auditable for the first time.
Step 4 — Pilot the full architecture on one legal entity or one payroll group. Run it in parallel with your existing close process for two or three periods before relying on it as your primary control. Build confidence in the exceptions output before you stop doing manual spot-checks entirely.
Every payroll close involves an act of faith: the assumption that what Oracle HCM calculated is what your finance system received. This architecture turns that assumption into a verified fact — automatically, every period, at full volume.
If you are working through an Oracle HCM implementation or optimising an existing costing integration, the reconciliation design decisions you make now will determine how confident your finance team feels at every close for years to come.
The data left Oracle correctly. Now you can prove it.